|
blog | oilshell.org
What Is a Data Frame? (In Python, R, and SQL)
2018-11-30
(Last updated 2020-02-20)
A data frame is a table-like data structure available in languages like
R and Python. Statisticians, scientists, and
programmers use them in data analysis code.
Once you've tried data frames, you'll reach for them during every data
analysis project.
This post introduces the concepts behind them, and then shows how they work by
solving the same problem in multiple ways:
- Without data frames, using straightforward but verbose Python code.
- With data frames in Python and R. You'll see that the underlying ideas
are the same, even when the language is different.
- With SQL, for another comparison.
To run the code, clone the oilshell/blog-code repo, then follow
the instructions in data-frames/README.md..
Why Write About Data Frames?
This blog is about a new Unix shell, so the connection to data frames
may not be obvious. I write about them for a few reasons:
-
In the last post, I analyzed Oil's code with data frames.
When writing the praise in that section, I looked for a friendly intro to
the idea, but the best hit was from an inactive Clojure project.
Surprisingly, Wikipedia doesn't have a page on data frames! This post aims
to fill that gap.
-
I've talked to more than one person who has done data analysis without
data frames, e.g. at Recurse Center.
-
Data frames may someday be a feature of the Oil language.
Why? Because the output of both ls and ps is a table. (Caveat: this
work is far in the future.)
Typical Operations
Before I show source code, here's some more color on how data frames are used.
You may:
- Create a data frame from the results of a SQL query, or from a CSV file.
The columns have types like string, number, and date.
- Filter a data frame down to the rows and columns of interest.
- Clean its values with arithmetic and string operations.
- Summarize groups of rows.
- Compute new columns based on existing columns.
- Join a data frame with others, for further analysis.
- Plot one column vs. another (in many different
ways)
- Mathematically model one column as a function of another — e.g. with linear
regression.
Logically, data frames look like SQL tables, but:
- They're manipulated directly in the memory of your program. They don't live
on a remote server.
- They more suited to complex, "offline" analysis with statistics,
visualization, and mathematical modeling.
An Example Analysis
The Problem
Here's a measurement of hits over time to different pages on a website:
| date |
URL |
hits |
| 2018-11-30 |
/site.html |
300 |
| 2018-11-30 |
/blog/ |
1,000 |
| 2018-12-01 |
/site.html |
320 |
| 2018-12-01 |
/blog/ |
1,300 |
| 2018-12-02 |
/site.html |
310 |
| 2018-12-02 |
/blog/ |
1,800 |
| 2018-12-02 |
/data-frames.html |
7,500 |
Let's analyze this data set in two ways.
- Daily Traffic: Total hits per day.
| date |
hits |
| 2018-11-30 |
1,300 |
| 2018-12-01 |
1,620 |
| 2018-12-02 |
9,610 |
- Popular Pages: The pages with the most hits, as a percentage of all
traffic.
| URL |
percentage |
| /data-frames.html |
59.9% |
| /blog/ |
32.7% |
| /site.html |
7.4% |
Notice that the first query aggregates over the date variable, while the
second aggregates over URL, then sorts by percentage.
How would we write code to do this analysis?
Without Using Data Frames
We could write imperative code with explicit loops, building data structures
cell-by-cell. I do this in without_data_frames.py, where the main()
function is a dense 30 lines of code.
Excerpt:
# ...

by_url = collections.defaultdict(int)
by_date = collections.defaultdict(int)
total_hits = 0

for date, url, num_hits in reader:
    num_hits = int(num_hits)
    by_date[date] += num_hits
    by_url[url] += num_hits
    total_hits += num_hits

# ...
This works for small problems, but becomes tedious as the analysis gets more
complex.
The next two solutions, using data frames, are shorter and use a functional
style. They're more like expressions on values rather than algorithms to
update mutable data structures.
Using the Pandas library in Python
Here's the core of the first query, excerpted from with_pandas.py:
# Daily Traffic
daily = traffic.groupby('date').sum()
Pandas uses the method chaining idiom on data frame objects.
It takes two steps to transform traffic into daily:
- Divide the rows into groups, such that each row in a group has the same
value for the
date column, e.g. 2018-11-30.
- Calculate the sum of the
num_hits column within each group.
The second query takes a few more steps:
# Popular Pages
popular = (
    traffic.groupby('url')
    .apply(lambda x: sum(x.num_hits) / total_hits * 100.0)
    .reset_index(name='percentage')
    .sort_values(by='percentage', ascending=False)
)
- Instead of
sum(), we apply a formula to each group, creating a new
percentage column.
- Then we sort the new rows by percentage, in decreasing order.
Using the dplyr library in R
R implementations of these queries use the same ideas. They may look less
familiar, due to a few features of R:
- Operator overloading, which lets us define a
%>% operator that
performs left-to-right function application. It's not part of R itself.
- Lazy evaluation, which removes the need for the
lambda you saw above
in Pandas.
- "Reversed" assignment lets you put the variable on the right, like this:
42 -> x # same as x = 42 or x <- 42
Here's core of the first query, excerpted from with_dplyr.R:
# Daily Traffic
traffic %>%
  group_by(date) %>%
  summarize(num_hits = sum(num_hits)) ->
  daily    # assign to variable 'daily'
The second query is similar:
# Popular pages
traffic %>%
  group_by(url) %>%
  summarize(percentage = sum(num_hits) / total_hits * 100.0) %>%
  arrange(desc(percentage)) ->
  popular    # assign to variable 'popular'
Again:
- The
summarize step uses a formula to compute a new percentage column.
- The
arrange step sorts the resulting data frame by decreasing percentage.
I like the %>% operator because it reads left-to-right like a Unix
pipeline. However, there are significant differences. The data passed
between stages is:
- structured,
- dynamically typed, and
- resides in memory.
The main point here is that data frames are a stable concept across
multiple languages. The syntax is different, but the idea is largely the same.
Appendix B solves the problem with "base R", rather than with
dplyr.
Using SQL
Raw SQL easily handles the Daily Traffic query:
SELECT date, SUM(num_hits) FROM traffic GROUP BY date;
It starts to look awkward for the Popular Pages query:
SELECT url,
       SUM(num_hits) * 100.0 / (SELECT SUM(num_hits) FROM traffic)
       AS percentage
FROM traffic
GROUP BY url
ORDER BY percentage DESC;
The inner SELECT clause is begging to be extracted into a total_hits
variable.
In run.sh, I've used a Common Table
Expression for total_hits, which will
improve readability in complex cases, but makes the code longer in this case.
It would be nice if SQL had Python-like scalar variables (i.e. variables that
aren't tables).
It could also be done with two separate queries and a Python variable, but this
would be incorrect in the face of concurrent updates. If someone adds a
row between the two queries, then the total percentage will be more than 100%.
As your analysis becomes more complex, the advantage of data frames over SQL
becomes clearer. In many contexts, it's useful to view SQL as a data
extraction language, while R or Python is the data analysis language.
Interlude
The rest of this post is biased toward R, because it's what I use for data
analysis. Feel free to leave a comment with analogous
resources for Python or other languages.
Useful Documents
- I really "got" data frames after reading Tidy Data by Hadley
Wickham. Key quote:
Tidy datasets are easy to manipulate, model and visualize, and have a
specific structure.
Each variable is a column, each observation is a row, and each type
of observational unit is a table.
Once the concepts are clear, using data frames is a matter of internalizing the
API through practice. I refer to this document most often:
Recommended Books
Disclosure: This section contains affiliate links. I earn a commission if
you buy a book.
I mentioned my desire to write book reviews a few times, and R and
data frames are good topics to start with.
Why? I've purchased at least six books on R, which tells me that it's the
hardest programming language I've learned. In comparison, I felt productive in
Python before buying any books at all.
I'm narrowing my recommendations to these two books:
I only recommend these books after you've written a few lines of code with
data frames, using online resources like the ones above. The runnable code
from this post may also be a useful starting point.
Other Books
I could write more about other books I own, but the short takeaway is that the
two above are the best for programmers that want to learn to use data frames.
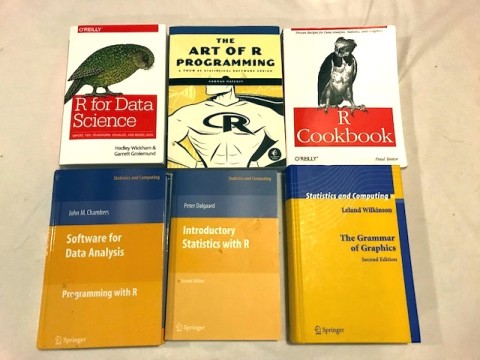
My copies:
R for Data Science was written by the creator of the tidyverse. The book
Python for Data Analysis is analogous since it was written by the creator of
Pandas:
However, I haven't read it, so I can't comment on its quality.
Conclusion
This post explained the concept of data frames, and showed concrete
examples of code in R, Python, and SQL.
I linked to my two favorite online resources about data frames, and two books
out of six that I found most useful.
If you're interested concrete examples of how I use R, see the last post.
Leave a comment if you have questions. There are further
thoughts and recommendations below.
Thanks to Eric Higgins and Yuri
Vishnevsky for valuable feedback on a draft of this post.
Appendix A: Implementations
Mentioned in this post:
- dplyr - A data frame library in the form of an elegant, shell-like
domain-specific language, as explained above.
- Pandas - A popular Python package, based on ideas from R.
- data.frame in base R. See Appendix B below. Functions like
subset(),
aggregate(), etc. are hard to remember and inconsistent with each other.
Other:
- data.table - Another R library/DSL for data frames. I've used it and
it's faster and more consistent than the data frames in base R.
- DataFrames.jl in Julia. I haven't used it, but it's based on ideas from
the R ecosystem.
- plyr - The predecessor to dplyr.
The wiki page I mentioned above has links to more implementations
(some of them defunct).
Please leave a comment if you have experience with another data
frame library.
Recommendations
If you're heavily invested in the Python ecosystem and don't know R, you may
want to try Pandas first.
Otherwise, I recommend learning R with dplyr and the rest of the
tidyverse.
A language that doesn't affect the way you think about programming, is not
worth knowing. — Alan Perlis
R is inconsistent and difficult to learn, but the tidyverse
largely fixes this:
- dplyr is more consistent than Pandas, and
- The tidyverse is more consistent than Python's equivalents, i.e.
libraries for plotting, statistics, and modeling. ggplot2 is a great
plotting library.
For what it's worth, I wrote code in five ways for this blog post, and I
found the dplyr version the most elegant. The syntax is a little unusual,
but the ideas fit together well.
(Regarding R vs. Python debates: I think the answer for many data science
problems is to use both. But I use R when the code requires data frames.)
Appendix B: Alternative Solution With "Base R"
For comparison, I've also written with_base_R.R, which uses functions built
into R, rather than the newer dplyr library.
It's not important to understand this code. I only include it to show that
dplyr is nicer.
The tidyverse, which includes dplyr, is essentially a "reform" of R,
enabled by Lisp-like metaprogramming. This is inspirational to me because
I hope to "reform" shell with the Oil language.
Appendix C: Is a Data Frame Just a Table?
(February 2020 Update)
Is a Data Frame Just a Table? (2019, PDF) is a great description
of data frames from a computer science perspective. This paper addresses two
different conceptions of tables and their usage in computer programs:
- Data analysts / statisticians: A table is a data frame.
- Computer scientists / database researchers: A table is a relation. The
relational model is the
foundation of SQL.
It discusses these differences between the models:
- The rows in a data frame are ordered, while relations are logically
unordered sets of rows.
- Unlike relations, data frames can be operated on like 2D matrices.
Matrices have elements of a single type (typically floats or ints), while
tables have columns of different types.
- Joins in current data frame implementations more limited.
- SQL started out as a declarative query language, but evolved procedural
features (much like shell, awk, and make). In
contrast, R and Python are general-purpose languages with imperative and
functional features.
- SQL has limited facilities for code reuse, as we saw in this example.
- SQL's declarative nature means that it can be optimized with a query
planner. This is a double-edged sword: databases can be more efficient than
data frames, but seemingly innocuous program changes can cause performance to
"fall off a cliff".
- Pandas has a messy API, which we also saw in this post. I think that's
because Python is still on version 1 of its API. The tidyverse is a
cleaned up version 2 of the "base R" API.

